Pixel Counting
Robert P. Munafo, 2012 Aug 18.
The Pixel Counting method is a method of estimating the area of the Mandelbrot Set and the location of its center of gravity. The technique amounts to little more than drawing the Mandelbrot Set on a very high-resolution grid and noting how many pixels fail to "escape".
Records
Currently (as of mid 2012) the best pixel-counting estimate for the area is that by Thorsten Forstemann: 1.5065918849 {+- } 2.8×10⁻⁹. (This is much better than my best estimate which has an error of± 2.07×10⁻⁸.)
The best estimate for the center of gravity is my 2012 measurement, -0.28676842048 ± 3.35×10⁻⁹.
These estimates were produced by my program LUAMS-3 (and a similar method by Förstemann). Both are brute-force pixel-counting programs that properly handle the sources of error described below. For example, LUAMS-3 counted 20 grids each with approximately 819200 by 409600 pixels, with a dwell limit of 419,430,400.
The Quest for Exact Values
It is not known whether either the area or the center-of-gravity has an exact value computable by a simple formula, but if it did, my equation finder RIES would probably discover it.
Cyril Soler found the expression √6π-1 - e ≅ 1.5065916514..., but this is well outside the 95% confidence interval. Another old hypothesis for the center of gravity, -((ln(3) - 1/3)F) ≅ -0.28676826338... (where F is the Feigenbaum Constant) is even further outside the margin of error.
Using RIES, the best candidate formulas appear to be:
(2 x2)x = 7 3√e
for the area (with the solution x = 1.5065918809303...), and:
x = 1/(π/24 - 2 - phi) = -0.286768422276356...
for the center of gravity.
Sources of Error in Grid Scans
Pixel Counting is susceptible to the following sources of error:
- The dwell limit is too low. Extra pixels that do not belong to the Mandelbrot Set will be counted. This can be fixed by using the infinite dwell limit method, or by using steadily larger dwell limits as you increase the grid size.
- Insufficient precision. If using integer math or single-precision floating-point, the roundoff error can throw off the results. IEEE double-precision is more than sufficient for pixel counting.
- Each pixel represents a square region of the plane and (generally speaking) a single corner of the square is evaluated. For pixels near the boundary, each pixel will be either an overestimate or an underestimate. The net effect of the overestimates does not necessarily cancel out the net effects of the underestimates. This results from aliasing errors and simple statistical sampling error. In theory it could also result from actual geometric properties of the Mandelbrot Set itself, but no-one has found any such structure which would contribute any significant amount to error in pixel counting (excepting those cases which are simple aliasing errors).
The features which most often cause aliasing errors are R2F(1/2B) (colloquially called the Spike) and R2.C(1/2) (known better as Seahorse Valley). Because the Spike is horizontal and Seahorse Valley is vertical, the grid can be easily aligned in such a way as to cause aliasing errors.
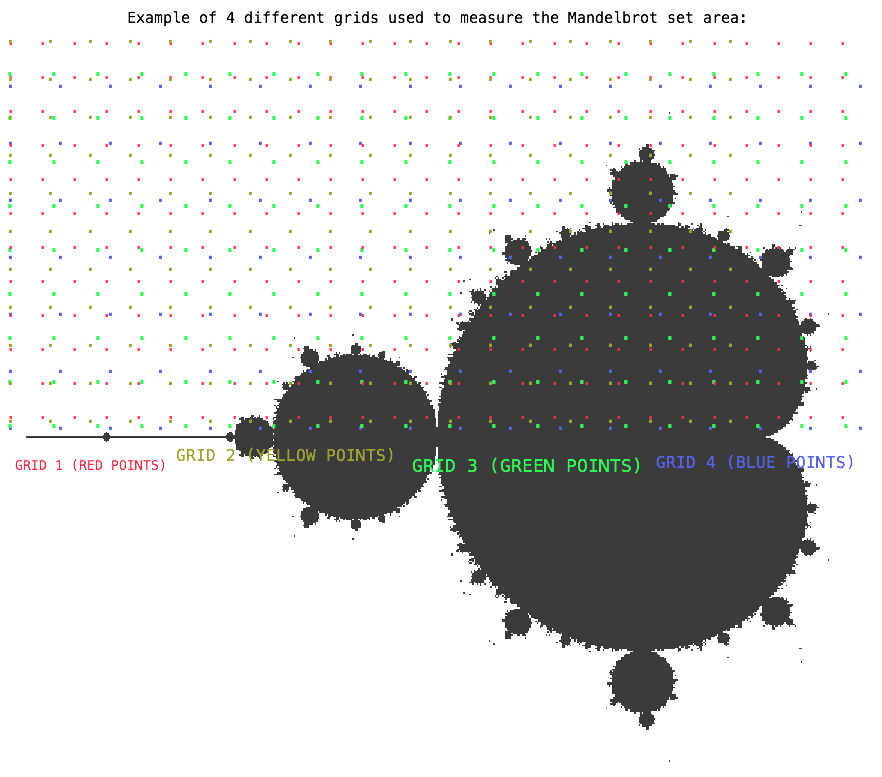
To determine the actual amount of error from aliasing and statistical sampling, it is best to compute a mean and a standard deviation from many seperate runs. In order for the standard deviation to be meaningful indication of measurement error, these separate runs need to as independent of each other as possible. I attempt to achieve this by having slightly different grid spacing, being shifted slightly along real and imaginary axes:

Four slightly different grids
Results
Here are some results of a set of such averaged runs. For each grid size, 20 runs were computed and averaged together. Each result (area and center of gravity) includes a standard uncertainty indication, for example "1.489(25)" means 1.489±0.025. based on a calculation of the standard error of the mean for 20 samples.
grid dwell center of size limit area gravity compute time ------ -------- --------------- --------------- ----------------- 25 12800 1.489(25) -0.2913(71) 374003 50 25600 1.5038(55) -0.2867(27) 1165490 100 51200 1.5040(28) -0.28678(84) 6582761 200 102400 1.50697(83) -0.28637(34) 25275440 400 204800 1.50668(35) -0.28679(11) 127007267 800 409600 1.50670(13) -0.286734(57) 597760805 1600 819200 1.506604(59) -0.286764(24) 2742756983 3200 1638400 1.506581(19) -0.2867648(71) 13057661386 6400 3276800 1.5065858(67) -0.2867654(32) 61081011697 12800 6553600 1.5065897(25) -0.2867692(10) 288527125329 25600 13107200 1.5065916(11) -0.28676830(53) 1359070589873 51200 26214400 1.50659221(52) -0.28676817(12) 6465978129741 102400 52428800 1.50659196(22) -0.286768396(46) 30786140599193 204800 104857600 1.506591978(93) -0.286768374(26) 146786742562045 409600 209715200 1.506591856(25) -0.286768422(11) 701625086921348 819200 419430400 1.506591887(21) -0.2867684204(36) 3362091531835366For the largest size "819200", I used 20 grids of sizes near 819200×409600 pixels.
Thorsten Forstemann has performed a very similar set of measurements, using a completely different set of software tools. As of mid 2012, he had gone as far as 2097152×2097152 (again with 20 complete grid-scans). For a link to his results see the Thorsten Forstemann article.
History of Area Estimate Results
See the Area History page.
See Also
My largest islands data are based on a large grid-scan to locate prospective islands, and an area measurement of each candidate; the latter uses the same 20-grids statistical technique.
See also Laurent series and Monte Carlo, the other methods of estimating the area of the Mandelbrot Set.
Acknowledgments
Formula for Mandelbrot area: Cyril Soler.
Area estimate (Pixel counting method): Jay Hill
Old USENET articles: G. A. Edgar (edgar at math ohio-state edu)
revisions: 20030925 oldest on record; 20101021 add link to largest islands page; 20120107 new, more precise pixel-counting estimate, and new formulas from RIES; 20120224 replace table with more recent version; 20120318 add my 819200×409600 gridsize result; 20120818 add Thorsten Förstemann results
From the Mandelbrot Set Glossary and Encyclopedia, by Robert Munafo, (c) 1987-2024.
Mu-ency main page — index — recent changes — DEMZ
This page was written in the "embarrassingly readable" markup language RHTF, and was last updated on 2012 Aug 19.
 s.27
s.27